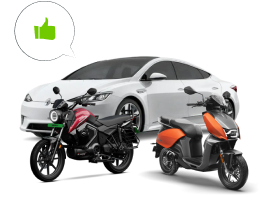
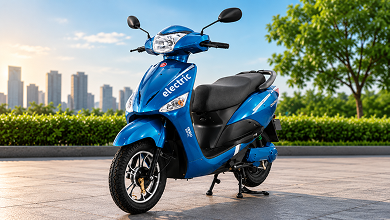
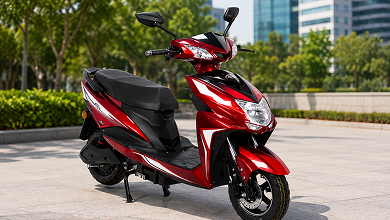
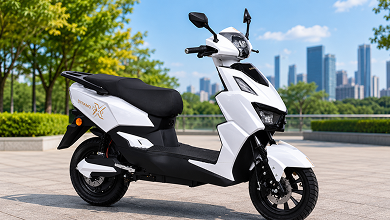

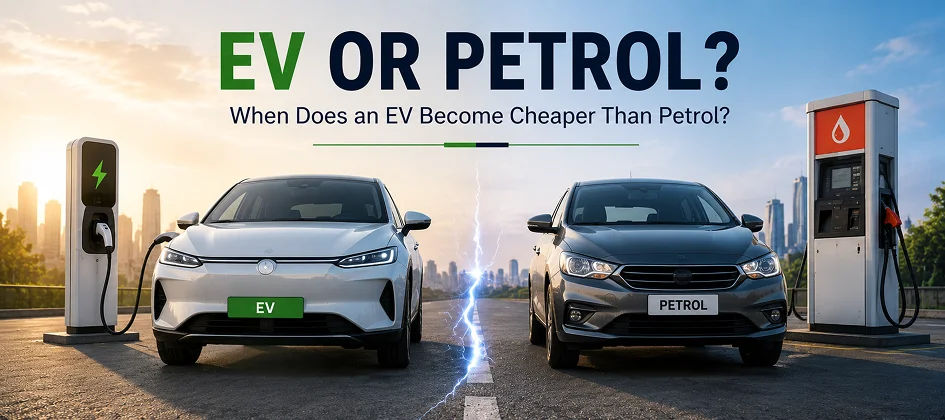
An electric vehicle (EV) becomes financially cheaper than a petrol vehicle when the cumulative savings from lower fuel/charging, maintenance, and operational expenses fully offset the higher upfront purchase price of the EV.
There is no universal break-even point. Depending on your annual mileage, local electricity tariffs, fuel prices, and specific vehicle segments, recovering the higher EV purchase price can take anywhere from 1.5 years (for high-mileage commercial users or heavy daily commuters) to 6+ years (for low-mileage city drivers).
The EV Break-Even Formula:
Break-Even Distance (km) = Additional Upfront Cost (INR) ÷ Savings/km (INR)
Break-Even Time (Years) = Break-Even Distance (km) ÷ Annual Usage (km)
The break-even point is influenced by twelve key financial variables:
EV Purchase Price vs. Petrol Vehicle Purchase Price (Upfront Price Premium)
Annual Distance Driven (Kilometres)
Petrol Price (INR/Litre) vs. Electricity Tariff (INR/kWh)
EV Energy Efficiency (Wh/km or km/kWh) vs. Petrol Vehicle Efficiency (km/Litre)
Routine Maintenance Costs
Insurance Premiums & Financing Costs
Depreciation & Estimated Resale Value
The EV break-even point is the milestone where the total cost of owning and operating an electric vehicle drops below the total cost of owning and operating a comparable petrol vehicle.
Because electric vehicles carry a price premium due to battery technology, you pay more on day one. However, every kilometre driven on electricity costs a fraction of a kilometre driven on petrol.
Break-even is evaluated in two distinct ways:
Break-Even Distance: The exact number of cumulative kilometres you must drive before the total fuel and maintenance savings equal the extra upfront cash spent on the EV.
Break-Even Time: The number of months or years required to complete that break-even distance based on your personal driving habits.
Quick Example:
If an electric scooter costs INR 30,000 more than an equivalent petrol scooter but saves you INR 2.00 per kilometre in running costs, your break-even distance is 15,000 km (INR 30,000 ÷ INR 2.00). If you ride 7,500 km per year, your break-even time is exactly 2 years.
To find your exact payback threshold, calculate the per-kilometre running cost difference between both power options:
Break-Even Distance (km) = (EV Purchase Price - Petrol Vehicle Price) ÷ (Petrol Cost Per KM - EV Cost Per KM)
Petrol Cost Per KM = Petrol Price (INR/Litre) ÷ Real-World Petrol Mileage (km/Litre)
Example: At INR 102.12 per litre in Delhi and a real-world city mileage of 14 km/L for a petrol car, the fuel cost is INR 7.29 per km.
EV charging is not 100% efficient. Plugging into an AC wall outlet results in a 10% to 15% energy loss through conversion and heat.
Wall Energy Consumption (kWh/km) = (Vehicle Efficiency (Wh/km) ÷ 1000) ÷ (1 - AC Charging Loss Factor)
EV Cost Per KM = Wall Energy Consumption (kWh/km) × Electricity Tariff (INR/kWh)
Example: A compact EV car consuming 130 Wh/km with a 12% AC wall charging loss draws 0.147 kWh per km from the socket. At an average domestic electricity rate of INR 7.50 per unit, the running cost is INR 1.10 per km.
Below is an illustrative comparison between a mid-size electric SUV and a comparable petrol SUV in India (assuming standard 2026 domestic tariffs and retail petrol rates):
| Parameter | Electric SUV | Petrol SUV |
| Ex-Showroom + On-Road Price | INR 1,750,000 | INR 1,450,000 |
| Upfront Price Premium | INR 300,000 (EV Premium) | Baseline |
| Fuel / Electricity Price | INR 8.00 / kWh (Domestic Slab) | INR 102.12 / Litre (Delhi) |
| Real-World Fuel Efficiency | 6.8 km / kWh (147 Wh/km) | 13.0 km / Litre |
| AC Charging Loss Factor | 12% (0.167 kWh drawn/km) | N/A |
| Energy / Fuel Cost Per KM | INR 1.34 / km | INR 7.85 / km |
| Estimated Maintenance Per KM | INR 0.40 / km | INR 0.90 / km |
| Total Operational Cost Per KM | INR 1.74 / km | INR 8.75 / km |
| Net Operational Savings Per KM | INR 7.01 / km (Saved by EV) | Baseline |
Calculating the Break-Even Threshold:
Upfront Price Difference = INR 300,000
Net Savings Per Kilometre = INR 8.75 - INR 1.74 = INR 7.01 / km
Break-Even Distance = INR 300,000 ÷ INR 7.01/km = 42,796 km
If Driven 12,000 km / year = 42,796 km ÷ 12,000 km/yr = 3.56 Years
If Driven 20,000 km / year = 42,796 km ÷ 20,000 km/yr = 2.14 Years
Note: This is an illustrative calculation. Actual break-even thresholds depend on your specific vehicle model, state tax incentives, local electricity DISCOM tariffs, fuel price fluctuations, and personal driving profile.
Annual usage is the single most decisive factor determining when an EV pays for itself.
Profile: Weekend drivers, local errand runners, retired individuals, or work-from-home professionals.
Break-Even Period: 5.0 to 6.5 Years
Financial Verdict: Low annual mileage delays financial recovery. If you keep vehicles for 7–10 years, an EV still makes long-term financial sense, but the immediate payback is slow.
Profile: Average daily urban commuters covering 30–35 km per day plus occasional weekend highway trips.
Break-Even Period: 3.2 to 4.0 Years
Financial Verdict: Fits within standard vehicle ownership cycles (5–7 years). Buyers enjoy 2 to 3 years of pure profit/savings after recovering the initial premium.
Profile: Daily long-distance intercity commuters, sales professionals, or multi-city drivers covering ~55 km daily.
Break-Even Period: 1.8 to 2.5 Years
Financial Verdict: Accelerates break-even. The higher purchase premium is wiped out rapidly, yielding massive cumulative cash savings over a 5-year ownership period.
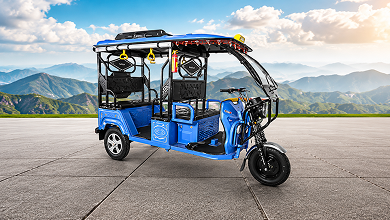
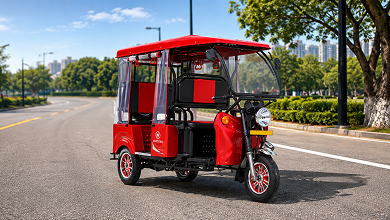
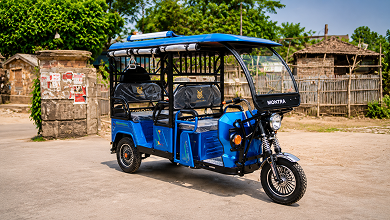
Profile: Ride-hailing taxis, delivery fleets, e-rickshaws, and last-mile cargo vans running 80–150 km daily.
Break-Even Period: 1.0 to 1.5 Years
Financial Verdict: Overwhelming financial superiority. Commercial operators reach break-even so fast that fuel savings frequently cover monthly vehicle EMI payments.
To see how cumulative savings compound over time, examine a 5-year comparison for an electric car versus a petrol car covering 15,000 km annually (total 75,000 km).
Assumptions: EV Upfront = INR 15,00,000 | Petrol Upfront = INR 12,00,000 | Price Difference = INR 3,00,000 | EV Running + Maint = INR 1.70/km | Petrol Running + Maint = INR 8.60/km | Net Savings = INR 6.90/km.
| Ownership Milestone | Cumulative EV Running Cost | Cumulative Petrol Running Cost | Net Operational Savings | Remaining Price Premium | Financial Status |
| Year 1 (15,000 km) | INR 25,500 | INR 129,000 | INR 103,500 | INR 196,500 | Recovering Initial Cost |
| Year 2 (30,000 km) | INR 51,000 | INR 258,000 | INR 207,000 | INR 93,000 | Approaching Break-Even |
| Year 3 (45,000 km) | INR 76,500 | INR 387,000 | INR 310,500 | -INR 10,500 | Break-Even Passed (~2.9 years) |
| Year 4 (60,000 km) | INR 102,000 | INR 516,000 | INR 414,000 | -INR 114,000 | Net Profit: INR 114,000 |
| Year 5 (75,000 km) | INR 127,500 | INR 645,000 | INR 517,500 | -INR 217,500 | Net Profit: INR 217,500 |
Energy cost per kilometre is the primary driver of EV economics. While petrol engines convert roughly 20–35% of energy stored in fuel into kinetic energy, electric powertrains achieve over 85–90% grid-to-wheel efficiency.
Petrol Vehicle: Consumes litres of fuel per 100 km. Gasoline contains high chemical energy density, but internal combustion engines lose most of it as heat and friction.
Electric Vehicle: Consumes kilowatt-hours (kWh) of electricity per 100 km. Motors convert electrical energy into rotation with minimal losses.
Manufacturer-claimed range (MIDC/WLTP) rarely matches real-world driving. Your real-world EV cost per km fluctuates based on the following:
City Traffic vs. Highway Driving: Unlike petrol cars (which get better mileage on open highways), EVs are more efficient in city stop-and-go traffic because lower speeds reduce drag and regenerative braking recycles braking energy.
Cruising Speed: Driving an EV at 110 km/h on motorways increases aerodynamic drag exponentially, consuming 30–40% more energy per km than driving at 65 km/h.
Cabin Air Conditioning: Heavy cooling in hot Indian summers (38°C–45°C) increases battery consumption by 12–18%.
Driving Style & Throttle Input: Rapid acceleration rapidly drains the battery, increasing Wh/km.
Payload Weight: Driving with five passengers or heavy luggage lowers range per charge.
Electric vehicles do not require regular engine maintenance. However, EV maintenance is not zero, and keeping realistic service expectations is essential for accurate financial modelling.
Petrol engines contain over 2,000 moving parts. Standard maintenance involves periodic engine oil flushes, oil filter swaps, air filter replacements, spark plug renewals, timing belt checks, transmission servicing, clutch plate repairs, and exhaust system upkeep.
Average Petrol Car Maintenance: INR 0.85 to INR 1.25 per km.
EV powertrains have under 50 moving parts. There are no engine oil changes, spark plugs, or exhaust systems. Maintenance focuses primarily on consumable parts:
Tyres: Wear out slightly faster due to instant electric motor torque and heavy battery packs.
Brakes: Experience dramatically lower wear because regenerative braking handles up to 70% of deceleration.
Cooling Systems: Periodic battery coolant flushes (every 40,000–60,000 km).
Suspension & Cabin Filters: Standard steering joints, suspension bushings, and AC air filters.
Average EV Car Maintenance: INR 0.30 to INR 0.45 per km (~50–60% savings).
Yes. Insurance premiums for electric vehicles are typically 10% to 25% higher than for equivalent petrol vehicles, primarily due to higher insured declared values (IDV) and specialised battery replacement costs.
Higher Upfront IDV: Because an EV has a higher purchase price than an equivalent petrol car, the own-damage (OD) insurance component starts at a higher premium.
Third-Party (TP) Rates: The Insurance Regulatory and Development Authority of India (IRDAI) periodically mandates discounted third-party insurance rates for electric vehicles to encourage adoption, partially offsetting higher OD costs.
Add-On Cover Requirements: EV owners often purchase specialised add-ons like Zero Depreciation, Battery Protect, and Drive Assurance, which add INR 4,000–INR 10,000 to annual premiums.
Financial Impact: Over a 5-year ownership period, paying an extra INR 8,000 per year for EV insurance adds INR 40,000 to the total ownership cost. This can push the break-even distance out by approximately 5,000 to 6,000 km.
Vehicle financing alters your break-even calculation because interest compounds on the higher initial purchase price of an EV.
If an EV costs INR 300,000 more than a petrol car, borrowing that additional INR 300,000 at a 9.5% annual interest rate over 5 years adds approximately INR 79,000 in interest charges.
Base Upfront Price Premium: INR 300,000
5-Year Loan Interest (9.5%): INR 79,000
Total Effective Price Premium: INR 379,000
Result: Increases required break-even distance by ~11,200 km!
Key Rule: When financing an EV, calculate your break-even using the Total Effective Cost Premium (Price Difference + Total Extra Interest Paid), not just the ex-showroom sticker price difference.
Resale value significantly influences long-term total cost of ownership (TCO). A vehicle with a higher purchase price can still deliver a lower net ownership cost if it retains a higher resale percentage after 5 years.
Battery Health Certificate (SOH): State of Health reports verifying that the battery retains 80%+ capacity strongly preserves resale value.
Transferable Battery Warranty: Most Indian manufacturers offer 8-year / 160,000 km battery warranties. Selling an EV at Year 5 leaves 3 years of factory coverage for the second buyer, boosting market confidence.
Brand Reputation & Software Updates: EVs backed by active over-the-air (OTA) updates and reliable charging networks hold value better.
Net 5-Year Ownership Cost = (Purchase Price + Energy + Maint + Ins + Finance) - Estimated 5-Year Resale Value
If an EV retains 55% of its value after 5 years while an equivalent petrol car retains 50%, the EV recovers a larger absolute cash sum upon resale, pulling the break-even point earlier.
The economics of electric mobility vary drastically across vehicle classes:
Upfront Price Premium: INR 20,000 – INR 40,000
Per KM Savings: INR 1.80 – INR 2.20 / km
Break-Even Distance: 12,000 – 18,000 km
Time to Break Even: 1.5 to 2.5 Years (at 25 km/day commuting).
Upfront Price Premium: INR 30,000 – INR 55,000
Per KM Savings: INR 1.70 – INR 2.10 / km
Break-Even Distance: 15,000 – 22,000 km
Time to Break Even: 2.0 to 3.0 Years.
Upfront Price Premium: INR 250,000 – INR 450,000
Per KM Savings: INR 6.00 – INR 7.50 / km
Break-Even Distance: 38,000 – 50,000 km
Time to Break Even: 3.0 to 4.5 Years (at 12,000–15,000 km/year).
Upfront Price Premium: INR 30,000 – INR 60,000
Per KM Savings: INR 2.50 – INR 3.50 / km
Break-Even Distance: 6,000 – 10,000 km
Time to Break Even: 6 to 10 Months (due to intensive 80–120 km daily commercial duty cycles).
Upfront Price Premium: INR 200,000 – INR 350,000
Per KM Savings: INR 5.50 – INR 7.00 / km
Break-Even Distance: 18,000 – 25,000 km
Time to Break Even: 1.0 to 1.8 years (fleet logistics operators).
Low annual driving distance (< 7,000 km/year)
Excessive reliance on expensive public DC fast chargers (INR 18–25/unit)
High upfront EV price premium over petrol baseline
High vehicle loan interest rates & long tenures
Expensive annual EV insurance premiums & add-on covers
Dropping petrol prices or rising electricity slab tariffs
High annual driving distance (> 18,000 km/year)
Exclusive access to low-cost home AC overnight charging
Rooftop solar installation (near zero per-unit electricity cost)
State government EV subsidies & road-tax/registration exemptions
Rising petrol prices
Strong battery health preservation boosting 5-year resale value
To calculate your personal break-even timeline before visiting a dealership, gather these 10 inputs:
Input 1: EV On-Road Purchase Price (INR)
Input 2: Petrol Vehicle On-Road Purchase Price (INR)
Input 3: Estimated Annual Distance (Kilometres)
Input 4: Current Petrol Price in your city (INR/Litre)
Input 5: Real-World Petrol Vehicle Mileage (km/Litre)
Input 6: Domestic Electricity Tariff Rate (INR/kWh)
Input 7: Real-World EV Efficiency (Wh/km or km/kWh)
Input 8: Estimated Annual Maintenance Costs for both options
Input 9: Annual Insurance Premium Difference (INR)
Input 10: Expected 5-Year Resale Value for both options
Below is a complete 5-year lifecycle cost comparison for a buyer covering 15,000 km/year (75,000 km total) comparing a compact electric car against a comparable petrol car in India:
| Lifecycle Cost Element | Electric Car (EV) | Petrol Car | Net Difference |
| On-Road Purchase Price | INR 1,450,000 | INR 1,150,000 | +INR 300,000 (EV Premium) |
| 5-Year Charging / Fuel Cost (75k km) | INR 100,500 (at INR 1.34/km) | INR 588,750 (at INR 7.85/km) | -INR 488,250 (EV Savings) |
| 5-Year Routine Maintenance | INR 30,000 (at INR 0.40/km) | INR 67,500 (at INR 0.90/km) | -INR 37,500 (EV Savings) |
| 5-Year Insurance Premiums | INR 130,000 | INR 105,000 | +INR 25,000 (Higher EV Cost) |
| Loan Interest Charges (80% loan) | INR 210,000 | INR 165,000 | +INR 45,000 (Higher EV Cost) |
| Gross 5-Year Outflow | INR 1,920,500 | INR 2,076,250 | -INR 155,750 |
| Less: Estimated Resale Value (Yr 5) | -INR 725,000 (50% value) | -INR 575,000 (50% value) | -INR 150,000 (EV Higher Value) |
| NET 5-YEAR LIFECYCLE COST | INR 1,195,500 | INR 1,501,250 | -INR 305,750 (NET EV SAVINGS) |
5-Year Total Net Financial Savings = Petrol 5-Year Net Cost - EV 5-Year Net Cost
= INR 15,01,250 - INR 11,95,500
= INR 305,750 Net Profit with EV!
Key Takeaway: Despite paying INR 300,000 more up front, driving 75,000 km over 5 years yields INR 305,750 in total net savings.
If your annual usage is below 6,000 km/year (~15 km per day), the financial math changes.
At low mileage, energy savings accumulate slowly. It may take 6 to 8 years just to recover an INR 300,000 price premium, during which loan interest and insurance overhead erode payback efficiency.
Non-Financial Benefits for Low-Mileage Buyers:
Zero Tailpipe Emissions: Eliminates local urban pollution
Superior Refinement: Instant torque, smooth acceleration, zero noise
Home Charging Convenience: Waking up to a "full tank" every morning
Low Maintenance Hassle: No periodic engine oil changes
Modern Technology: Advanced connected tech & cabin pre-cooling
Verdict: If your primary goal is pure financial payback, low-mileage buyers may find a petrol vehicle or hybrid more cost-effective. However, if premium refinement, zero noise, modern tech, and environmental benefits matter to you, an EV remains a compelling choice regardless of payback period.
For high-mileage users, an EV is one of the best financial investments available in the automotive market.
Daily Long-Distance Commuters (50+ km/day): Recovers upfront price premiums in 2.0 to 2.5 years.
Ride-Hailing & Taxi Fleets (120+ km/day): Saves INR 25,000–INR 35,000 per month in fuel, delivering break-even in under 14 months.
Last-Mile Delivery Vans & Cargo 3-Wheelers: Cuts delivery cost per parcel by 60–75%, directly increasing business profit margins.
There is no single universal break-even threshold for every buyer. An electric vehicle does not automatically become cheaper on day one, nor does it take forever to pay for itself.
The Bottom Line:
EV economics are governed by the balance between UPFRONT PRICE PREMIUM and ANNUAL KILOMETRES DRIVEN.
HIGH MILEAGE (>15,000 km/yr): Break-even in 1.5 to 3 years. An EV is a clear financial winner.
AVERAGE MILEAGE (10,000–15,000 km/yr): Break-even in 3 to 4 years. Delivers strong savings over a 5–7 year ownership cycle.
LOW MILEAGE (<7,000 km/yr): Break-even takes 5.5+ years. Buy for refinement, technology, and zero emissions not quick ROI.
Before committing to a purchase, use your actual daily commuting distance, local electricity tariff, petrol price, and exact vehicle quotes to calculate your personalised break-even distance. For average to high-mileage drivers across India, switching to electric power remains one of the smartest long-term mobility investments available.


Manage reminders, payment status, and renewal dates from one simple app.


Trusted by policyholders to track every renewal.