


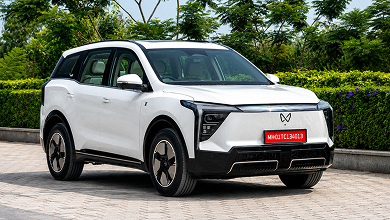
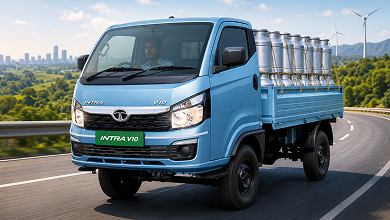
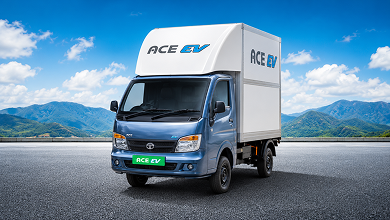
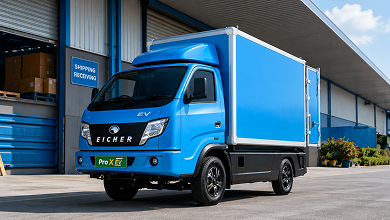






The last-mile logistics landscape in India is undergoing a dramatic shift. With rising fuel prices, expanding e-commerce networks, and stringent emission targets across major metropolitan hubs like Mumbai, Delhi, Bengaluru, and Ahmedabad—as well as rapidly growing tier-2 commercial hubs like Rajkot and Surat—fleet operators and business owners are taking a hard look at fleet electrification.
However, transitioning from a conventional petrol or diesel cargo vehicle to an electric delivery vehicle is fundamentally a financial decision. While electric commercial vehicles offer significantly lower per-kilometre running costs, they often come with a higher initial purchase price.
How can an Indian delivery business, courier service, or local distributor determine whether an electric cargo vehicle will generate a real return on investment (ROI)?
This comprehensive guide breaks down how to use an electric delivery vehicle ROI calculator, evaluate operating expenses, calculate monthly delivery revenue and profits, and determine your exact payback period with realistic Indian market assumptions.
An electric delivery vehicle ROI calculator is a financial estimation tool designed to help commercial vehicle buyers, fleet managers, and logistics entrepreneurs model the financial outcomes of adopting electric cargo vehicles.
Rather than relying on vague marketing claims of "up to 80% fuel savings", an ROI calculator analyses your actual operational metrics to estimate:
Initial Upfront Investment: Vehicle purchase price after subsidies, charging infrastructure, insurance, registration, and body modifications.
Monthly Operating Costs: Electricity consumption based on local tariffs, charging losses, routine maintenance, tyres, driver wages, and insurance renewals.
Monthly Delivery Revenue: Revenue generated through per-delivery fees, per-kilometre rates, or fixed monthly logistics contracts.
Monthly Operating Profit: Net revenue remaining after deducting recurring vehicle-level operational costs.
Monthly Fuel/Energy Savings: The incremental cost difference between running an electric delivery vehicle versus an equivalent petrol or diesel vehicle.
Payback Period: The exact time (in months) required for cumulative operating savings to offset the higher initial purchase price of the electric vehicle.
Return on Investment (ROI %): The net financial gain expressed as a percentage of the total capital invested over a chosen ownership horizon (e.g., 3 to 5 years).
Important Note: An ROI calculator provides a model based on operational inputs and assumptions. It generates realistic financial estimates, not guaranteed earnings. Actual profits depend on daily vehicle utilization, route efficiency, electricity tariffs, driver habits, and maintenance upkeep.
To build an accurate financial model, you must capture the full operational picture. Omitting hidden expenses—such as charging losses or vehicle downtime—will distort your projected profitability.
On-Road Vehicle Price: Ex-showroom price minus applicable central or state government incentives (such as PM E-DRIVE or state EV policies in Gujarat, Maharashtra, or Delhi), plus TCS and registration fees.
Charging Infrastructure: Installation of a dedicated 15A socket, wallbox AC charger, or commercial fast-charging setup at your depot or home.
Cargo Body Modifications: Customised containers, insulated boxes for cold-chain delivery, or side-curtain body fabrication.
First-Year Insurance & Permits: Commercial vehicle insurance (3-year TP + 1-year OD) and commercial transport permits.
Energy and Fuel Costs: Daily kilometres x Energy Consumption x Electricity Tariff div Charging Efficiency.
Maintenance & Servicing: Routine health checks, tyre wear, brake pad replacements, suspension bushings, and gearbox oil changes.
Driver & Labour Expenses: Monthly driver salaries, performance incentives per delivery, loading/unloading labour costs, and statutory compliance (PF/ESI).
Financing Costs: Monthly loan EMIs (distinguishing interest portion and principal amortisation).
Other Overhead Expenses: Annual insurance renewals, commercial permits, municipal parking charges, tolls, delivery platform commission fees, and downtime allowance.
To calculate monthly energy costs accurately, consider three key factors:
Charging Efficiency Loss: AC-to-DC conversion during charging typically incurs an 8% to 12% efficiency loss. Always add ~10% to your raw kWh calculation.
Commercial Electricity Tariffs: Commercial electricity rates in India vary by state and slab, typically ranging between INR 6.50 and INR 9.50 per kWh for commercial connections or INR 8.00 to INR 12.00 per kWh at public fast-charging stations.
Vehicle-level revenue depends entirely on your last-mile logistics business model in India:
Per-Delivery Rate Model (E-commerce / Food / Grocery):
Common for last-mile delivery partners working with platforms like Amazon, Flipkart, Zomato, or Blinkit.
Common for courier logistics, B2B wholesale distribution, and regional cargo transport.
Fixed Monthly Fleet Rental / Hire Contract:
A dedicated monthly fee paid by a corporate client or logistics company to rent the vehicle along with or without a driver.
To keep your financial projections accurate:
Account for Unloaded/Return Trips: Empty return legs generate zero revenue but consume energy.
Factor in Vehicle Downtime: Base monthly calculations on 25 to 26 operating days rather than a full 30 days to account for maintenance, holidays, or driver absence.
Route Inefficiencies: Traffic congestion in dense urban corridors (e.g., Surat Textile Market or Old Delhi) reduces total daily deliveries completed per shift.
To calculate vehicle-level profitability, use two distinct calculations depending on whether you want to measure pure operational performance or cash flow.
Where monthly operating expenses include:
Return on Investment evaluates the financial efficiency of the vehicle over its useful operating life (typically modelled over 36 to 60 months).
Where:
Total Initial Upfront Investment = Down Payment + Upfront Registration/Insurance + Charger Installation Costs.
Cumulative Net Returns = (Monthly Operating Profit x Months of Operation) - Battery Replacement/Resale Adjustments -Total Interest Paid.
The payback period measures how long it takes for the recurring operational savings of an electric delivery vehicle to recover the additional upfront cost compared to a conventional diesel or petrol vehicle.
Where:
Additional Upfront Investment = Total Initial Cost of EV – Total Initial Cost of ICE Vehicle.
Monthly Net Operating Savings = Monthly Running Cost of ICE Vehicle (Fuel + Maint) – Monthly Running Cost of EV (Electricity + Maint).
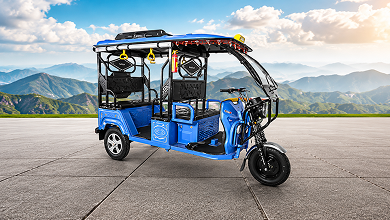
To demonstrate how these calculations work in practice, let us examine a hypothetical comparison between an L5N Electric Cargo Three-Wheeler (e.g., 500 kg payload capacity) and an equivalent L5N Diesel Cargo Three-Wheeler operating in a tier-2 commercial city like Rajkot, Gujarat.
Daily Distance: 100 km/day
Operating Days: 26 days/month (2,600 km/month)
Electricity Tariff (Commercial Gujarat): INR 7.50 / kWh
EV Real-World Efficiency: 12 km / kWh (Energy consumption = 0.083 kWh/km)
Charging Losses: 10%
Diesel Fuel Price (Assumed): INR 92.00 / litre
Diesel Mileage (Loaded Urban Driving): 22 km/litre
Monthly Delivery Contract Revenue: INR 42,000 / month
| Financial Metric | L5N Electric Cargo 3W | L5N Diesel Cargo 3W | Difference / Benefit |
| Ex-Showroom & On-Road Upfront Cost | INR 3,60,000 | INR 280,000 | EV is INR 80,000 higher. |
| Charger Setup & Initial Expenses | INR 10,000 | INR 0 | EV is INR 10,000 higher. |
| Total Initial Investment (A) | INR 370,000 | INR 280,000 | Additional EV CapEx: INR 90,000 |
| Monthly Distance | 2,600 km | 2,600 km | Same |
| Fuel / Energy Required | 2,600/12 = 216.7 kWh (+10% = 238.3 kWh) | 2,600/22 = 118.2 litres | — |
| Monthly Energy / Fuel Expense | 238.3 x INR 7.50 = INR 1,787 | 118.2 x INR 92.00 = INR 10,874 | EV saves INR 9,087 / month. |
| Maintenance & Servicing Allowance | INR 800 (INR 0.31/km) | INR 2,200 (INR 0.85/km) | EV saves INR 1,400 / month. |
| Insurance & Permit Allowance | INR 1,000 | INR 1,000 | Same |
| Driver Salary | INR 15,000 | INR 15,000 | Same |
| Total Monthly Operating Cost (B) | INR 18,587 | INR 29,074 | Total EV Savings: INR 10,487 / mo |
| Monthly Revenue (C) | INR 42,000 | INR 42,000 | Same |
| Monthly Operating Profit (C - B) | INR 23,413 | INR 12,926 | EV profit is INR 10,487 higher |
Additional Upfront CapEx for EV: INR 370,000 - INR 280,000 = INR 90,000
Monthly Net Operating Savings: INR 29,074 - INR 18,587 = INR10,487 per month
Payback Period:
Within less than 9 months, the electric cargo three-wheeler completely recovers its higher initial purchase price through operational fuel and maintenance savings.
Over a 36-month operating lifecycle (assuming 93,600 total kilometres driven):
Cumulative 3-Year Operating Savings: INR 10,487 x 36 = INR 3,77,532
Net Financial Benefit (Savings minus initial extra CapEx): INR 3,77,532 - INR 90,000 = INR 2,87,532
When evaluating commercial electric vehicles on eVehicals.com, gather these precise inputs from your actual business records rather than relying on estimates:
Payload Requirement: Legal payload weight in kg and volumetric cargo space in cu. ft.
Actual Daily Distance: Realistic average kilometres driven per shift.
Monthly Operating Days: Number of operational days per month (typically 25 or 26 days).
Target Ownership Period: Operational lifespan planned for the vehicle (e.g., 3, 4, or 5 years).
On-Road Price: Net cost after deducting central (e.g., PM E-DRIVE) or state EV incentives.
Financing Terms: Down payment amount, loan interest rate, and repayment tenure.
Local Electricity Tariff: Commercial slab rate per kWh at your primary charging location.
Tested Real-World Range: Tested range on a full load rather than certified ARAI lab figures.
Current Fuel Prices: Prevailing local rates for petrol, diesel, or CNG.
Several key operational factors can either enhance or diminish your monthly EV profit margin:
Electric commercial vehicles thrive on high utilization. Because the primary advantage of an EV lies in its lower per-kilometre cost (roughly INR 0.60–INR 0.90/km for EVs vs. INR 3.50–INR 4.50/km for diesel/CNG), the more kilometres you drive daily, the faster your payback period and the higher your net savings. A vehicle driving 120 km/day will achieve ROI twice as fast as one driving 50 km/day.
Carrying loads beyond rated capacity forces the electric motor to draw higher current from the battery pack, reducing real-world range by 15% to 25%. Similarly, aggressive acceleration and sudden braking disable regenerative energy recovery, raising your per-kilometre energy costs.
For high-mileage fleets running double shifts (150+ km/day), incorporating a 30-minute afternoon DC fast-charging session during driver lunch breaks extends daily operational capability without requiring a larger, more expensive battery pack.
E-Commerce & Hyperlocal Grocery:
Features high stop-start density, low payload requirements (200–500 kg), and average daily routes of 80–120 km. Generates maximum savings due to regenerative energy recovery in urban traffic.
Courier & Parcel Express Services:
Operates on fixed route circuits, carrying medium payloads (400–800 kg) across 100–150 km daily. Offers highly predictable charging schedules and steady contract revenue.
B2B Wholesale & FMCG Distribution:
Handles heavy payloads (800–1,500 kg) across 60–100 km daily routes in commercial corridors. Requires larger L5N 3W or 4W SCVs, leading to a slightly longer CapEx recovery timeline.
Confusing Gross Revenue with Profit: Never treat total monthly delivery earnings as profit. You must deduct energy, maintenance, driver salaries, insurance, and loan EMIs.
Comparing Incompatible Vehicle Classes: Comparing a light electric cargo three-wheeler with a 1.5-tonne diesel Four-Wheel Small Commercial Vehicle (SCV) leads to false conclusions. Always compare vehicles with equivalent payload capacities and cargo volumes.
Ignoring Charging Losses: Failing to account for the ~10% AC-to-DC conversion loss results in underestimating monthly electricity bills.
Relying on Laboratory Range Ratings: Basing daily delivery routes on unladen lab-tested range figures leads to unexpected battery depletion during mid-day deliveries.
Overlooking Subsidy Eligibility Criteria: Ensure the specific vehicle model is officially listed under active central (e.g., PM E-DRIVE) or state EV subsidy portals before factoring incentives into your purchase price.
Double-Counting Loan Depreciation & EMI: When calculating cash flow, subtract the actual monthly EMI. When calculating accounting net profit, deduct interest expense and asset depreciation instead.
Calculating the ROI of an electric delivery vehicle is a straightforward, quantitative process. For last-mile operators in India driving over 80 km per day, lower per-kilometre energy costs and reduced maintenance expenses make electric commercial vehicles a compelling financial investment.
By evaluating real-world energy consumption, accounting for charging conversion losses, setting realistic daily mileage targets, and tracking monthly cash flow, you can make an informed decision for your commercial fleet.
Ready to explore commercial electric vehicles for your business? Visit eVehicals.com to compare electric cargo three-wheelers and four-wheelers, evaluate real-world specifications, check regional prices, and find the right electric commercial vehicle for your last-mile logistics needs.



Manage reminders, payment status, and renewal dates from one simple app.


Trusted by policyholders to track every renewal.